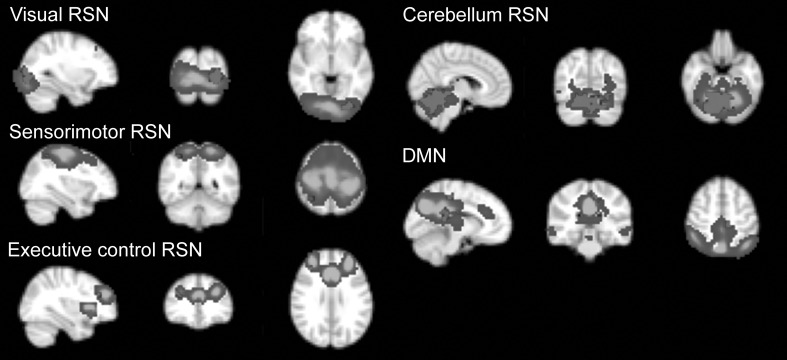
Fig. 2.
Between-group differences in resting-state networks (RSN). Cold colours represent the spatial map of the corresponding network (the Z-score colour scale is from 5 to 30), red colour represents the clusters showing the differences between TBI patients and healthy controls. The left side of the brain corresponds to the right side in the image. DMN default-mode network (colour figure online)

