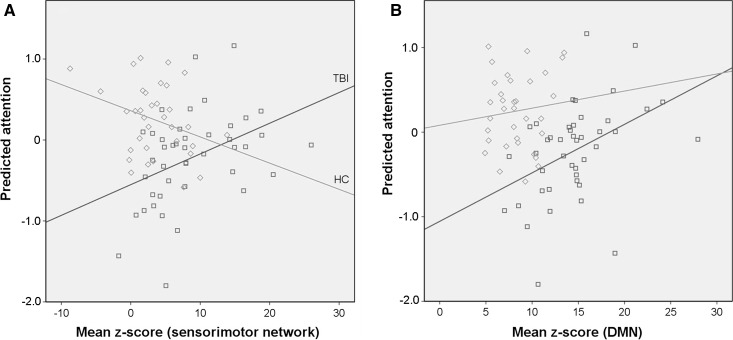
Fig. 3.
Relation between functional connectivity strength and attention score in sensorimotor network (a) and the default-mode network (DMN) (b). Mean Z-score is derived by averaging within the clusters showing the differences between the traumatic brain injury patients (TBI) and healthy controls (HC) in the corresponding RSN. Unstandardized predicted value for attention is the output of the linear regression where the group variable, mean Z-scores from five RSNs, and five interactions between group variable and Z-scores are taken as independent variables with correction for nuisance covariates (age, sex, and education). TBI group is in blue, HC group is in green. a R 2 linear = 0.172 (TBI), R 2 linear = 0.095 (HC) and b R 2 linear = 0.185 (TBI), R 2 linear = 0.011 (HC)

