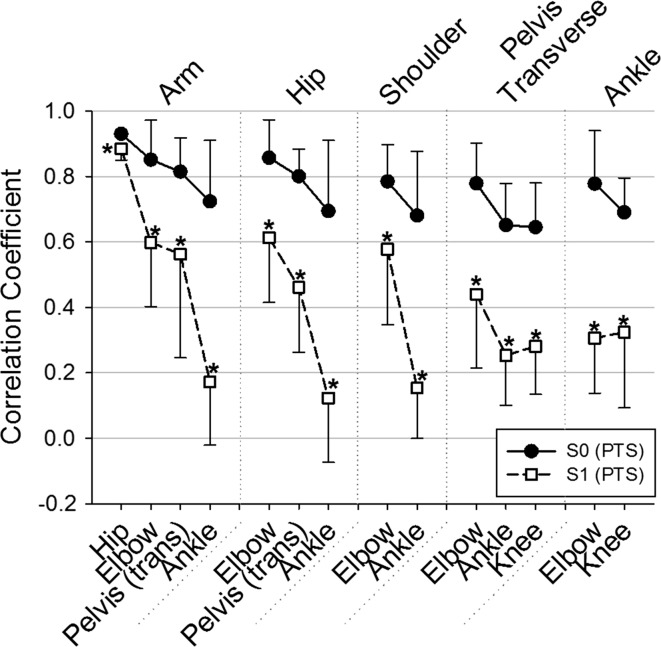
Fig. 2.
Mean correlation coefficient values for S0 and S1 at PTS between each of the variables presented on the x-axis and the motion of the arm, hip, shoulder, pevis (transverse plane) and ankle angles. Only correlations that presented a significant change between S0 and S1 are presented here. Error bars represent within-participant standard deviation. *p < 0.05

