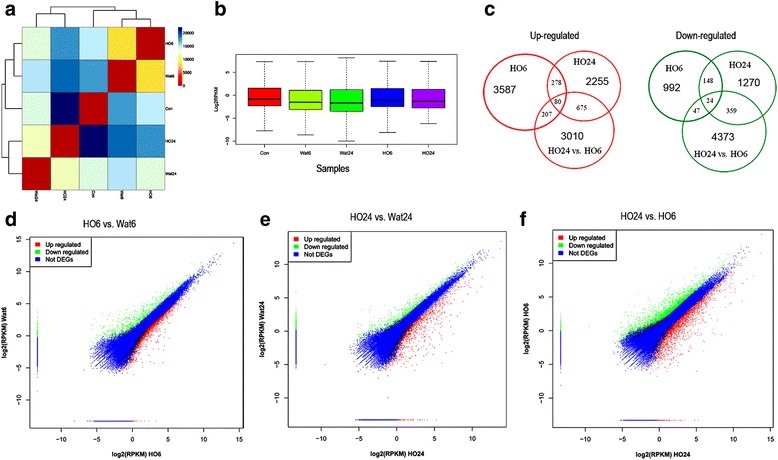
Fig. 1.

Analysis of RNA-Seq data and comparison of expressed unigenes between the samples. a Heatmap of the samples based on RPKM data. b Boxplot of the samples based on RPKM data. c Venn maps of up-regulated and down-regulated genes between the sample pairs. d-f Scatter plot comparing the gene expression levels in HO6 vs. Wat6, HO24 vs. Wat24, and HO24 vs. HO6
