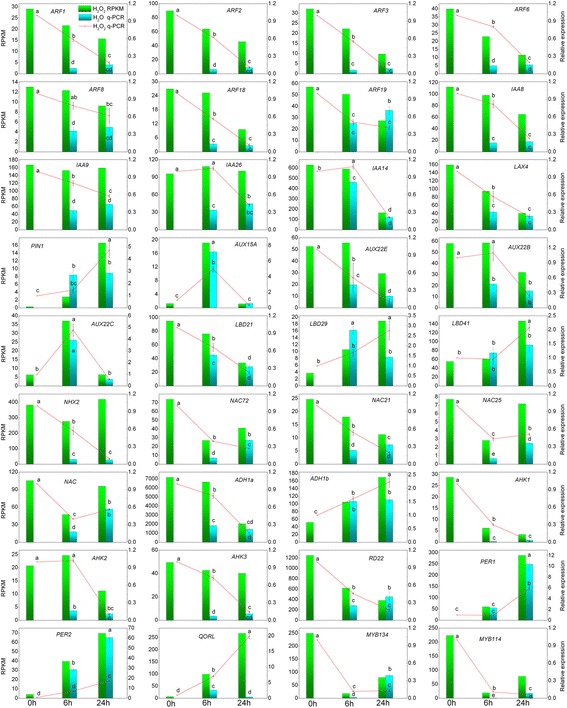
Fig. 5.

Validation for the RNA-Seq data using qRT-PCR. The qRT-PCR data were compared with RNA-Seq data and the Con, Wat 6, and Wat 24 data were from our previous study [29]. Bars represent the mean (±SE) of three replicates. Different letters (a, b, and c) represent statistically significant differences (P <0.01) among the qRT-PCR data, which were analysed using Student’s t-test
