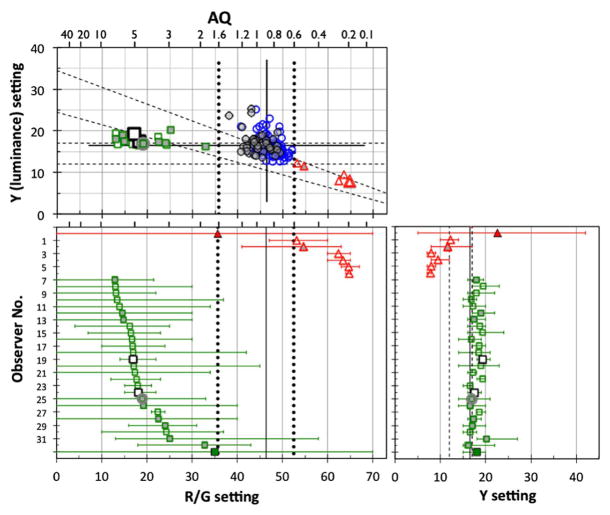
Fig. 1.
R/G and Y settings of Rayleigh matches on the anomaloscope based on the mean of three to five free-matching trials for 194 subjects. (Top panel) R/G versus Y settings. (Bottom left) Mean of R/G setting with the range between maximum and minimum matches for observers who were not classified as normal trichromats. (Bottom right) Mean of Y setting with range. Protanomalous (triangles) and deuteranomalous (squares) subjects were differentiated from color normals (circles). Bottom panels also show data of one protanopic (filled triangles) and one deuteranopic (filled squares) subject in this study. Open and gray symbols denote the data of observers younger and older than 60 years, respectively. R/G and Y settings were the means of all satisfied matches for each observer. Two larger open squares (observer #19 and #24) denote “mild anomalous subjects” as classified by the CCT (as explained elsewhere). The square with gray circle (#25) denotes “the subject showing high thresholds” on the CCT (see Fig. 6 and text for details). Diagonal and horizontal dashed lines in the top panel denote auxiliary lines by the anomaloscope manufacturer for separating protanopes (protanomaly) and deuteranopes (deuteranomaly), respectively. Solid vertical and horizontal lines denote the mean of all normal observers. Vertical dotted lines denote R/G settings corresponding to anomalous quotients (AQ) of 1.6 and 0.6. Vertical dashed lines in the bottom right panel denote the manufacturer’s deuteranomaly line. Numbers at the top of the panels denote AQs.

