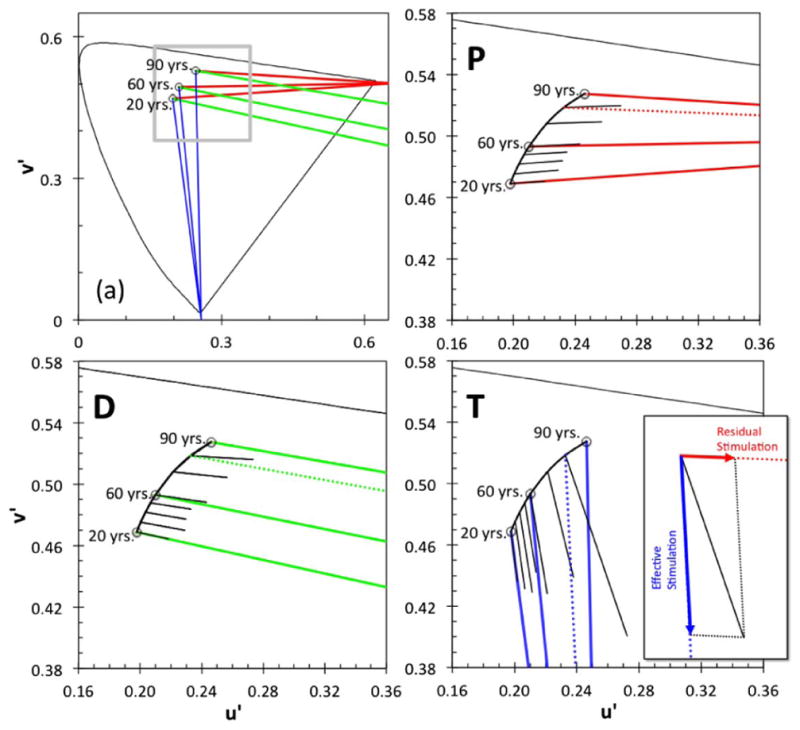
Fig. 2.

(a) Protan (red), deutan (green), and tritan (blue) vector directions for 20-, 60-, and 90-year-old “standard observers” in u′v′ chromaticity coordinates, starting from the shifted white background, calculated on the basis of age-related changes in the ocular media. The gray inset denotes the portion of the chromaticity diagram shown in panels P, D, and T depicting magnified color confusion lines (colored lines) and the average of measured vector lengths (black lines) of protan (P), deutan (D), and tritan (T) vectors for each decade (±5 years, but the 80-year-old group includes one 88-year-old observer), multiplied by a factor of 5 for clarity. Dotted lines denote confusion lines starting at white for an 80-year-old standard observer (not shown in Fig. 2(a)). These age-dependent vectors originate from different backgrounds and have a different slope than the nominal CCT color confusion lines because chromaticities of the white background and the targets are shifted by age-related changes in the ocular media, calculated from the bilinear model. The inset in panel T shows an example of effective stimulation (tritan vector) and residual stimulation (in the case of protan vector) caused by the original (uncorrected) tritan test.
