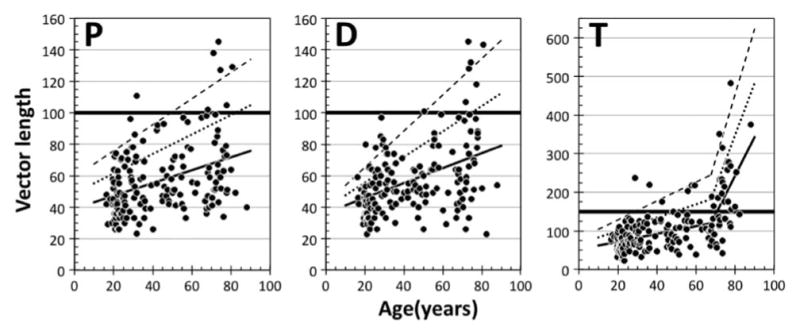
Fig. 3.

Protan (P), deutan (D), and tritan (T) CCT vector threshold data plotted in separate panels as a function of age. The solid lines were fitted by linear regressions. Note that the tritan data were fitted with two linear regressions as suggested by modeling. In each panel, dotted and dashed lines represent the mean +1 SD and +2 SD, respectively (see text for details). The thick solid horizontal line represents the maximum threshold for each vector expected for a normal trichromat, as given by the developers of the CCT (100 for protan and deutan vectors and 150 for the tritan vector). Note the different y-axis range on the tritan plot.
