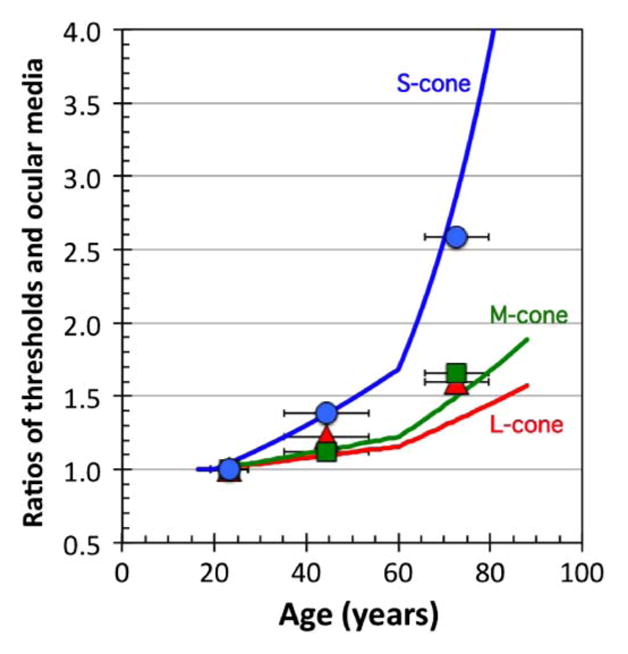
Fig. 8.

Ratio of measured thresholds (vector lengths) calculated from tolerance limits (as in Table 2) for protan (red triangles), deutan (green squares), and tritan (blue circles) tests and ratio of ocular media density for L- (red curve), M- (green curve), and S- (blue curve) cones calculated with the bilinear model. These ratios are based on the youngest age group (16–30 observer group) and 20-year-old standard observer (see text for details). Horizontal error bars denote standard deviations of age in each observer group of tolerance limits.
