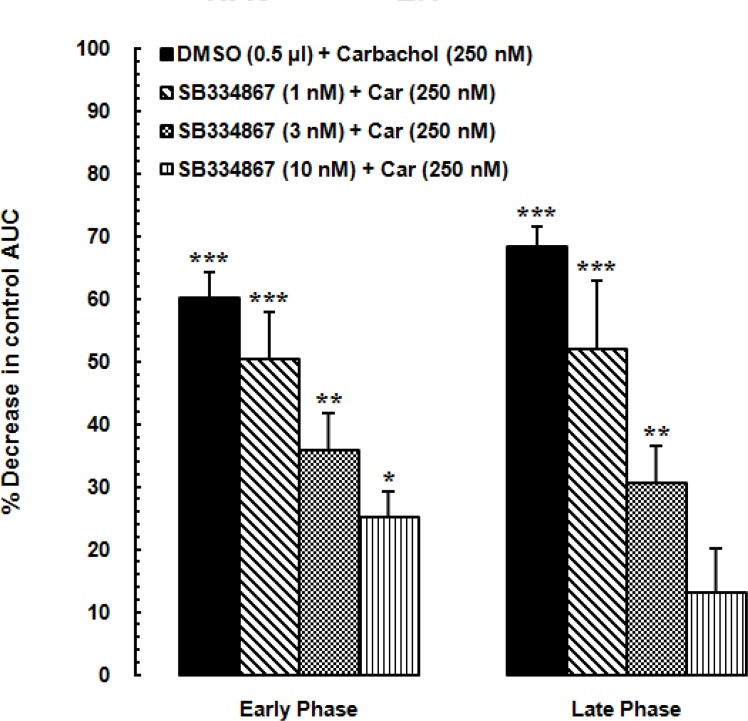
Figure 4.
Diagram showing percentage decrease in the area under the curve (AUC) values calculated for treatment groups compared to the AUC value calculated for the vehicle-control group. SB334867 (1, 3 and 10 nM/0.5μL DMSO) or 0.5 μL DMSO injected into the nucleus accumbens (NAc) before administration of the carbachol into the LH. The AUC values calculated for treatment groups were normalized by that of the vehicle-control group.
*P<0.05, **P<0.01, ***P<0.001 different from the vehicle-control group.

