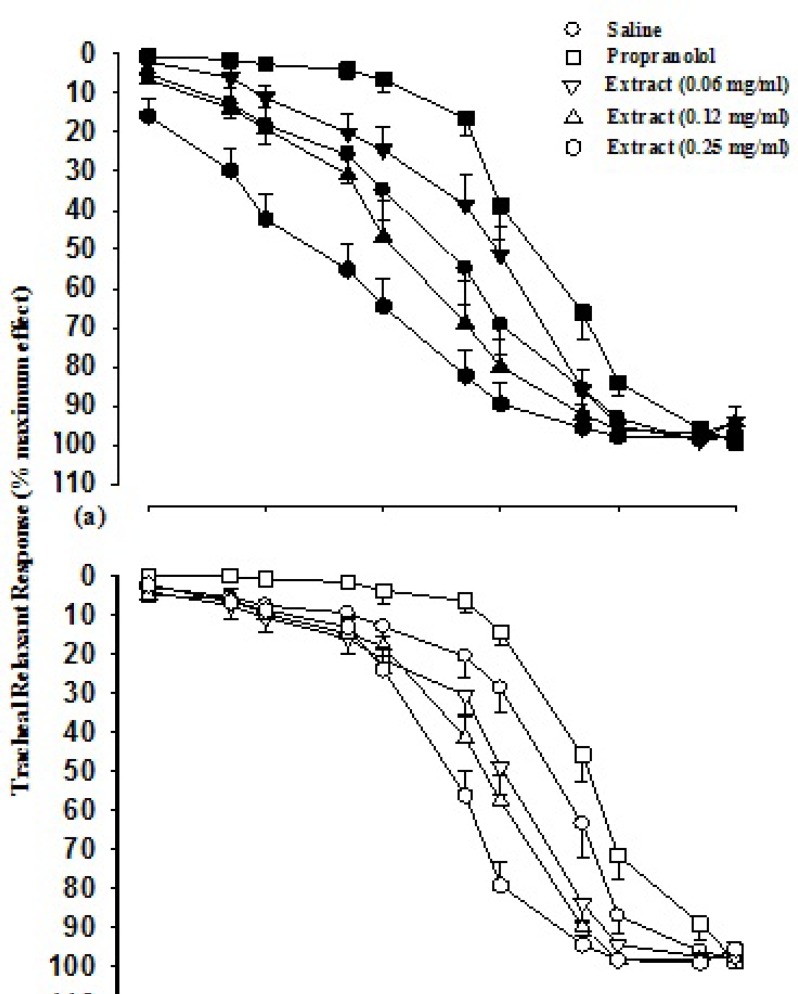
Figure 1.
Cumulative log concentration-response curves of isoprenaline induced relaxation of guinea pig tracheal smooth muscle(percent relaxation), in the presence of saline, three concentrations of aqueous-ethanolic extractand 10 nM propranolol. Data are presented as mean±SEM. Group 1 (a) is on non-incubated (n=7), and group 2 (b) on incubated tissues with chlorpheniramine (n=5

