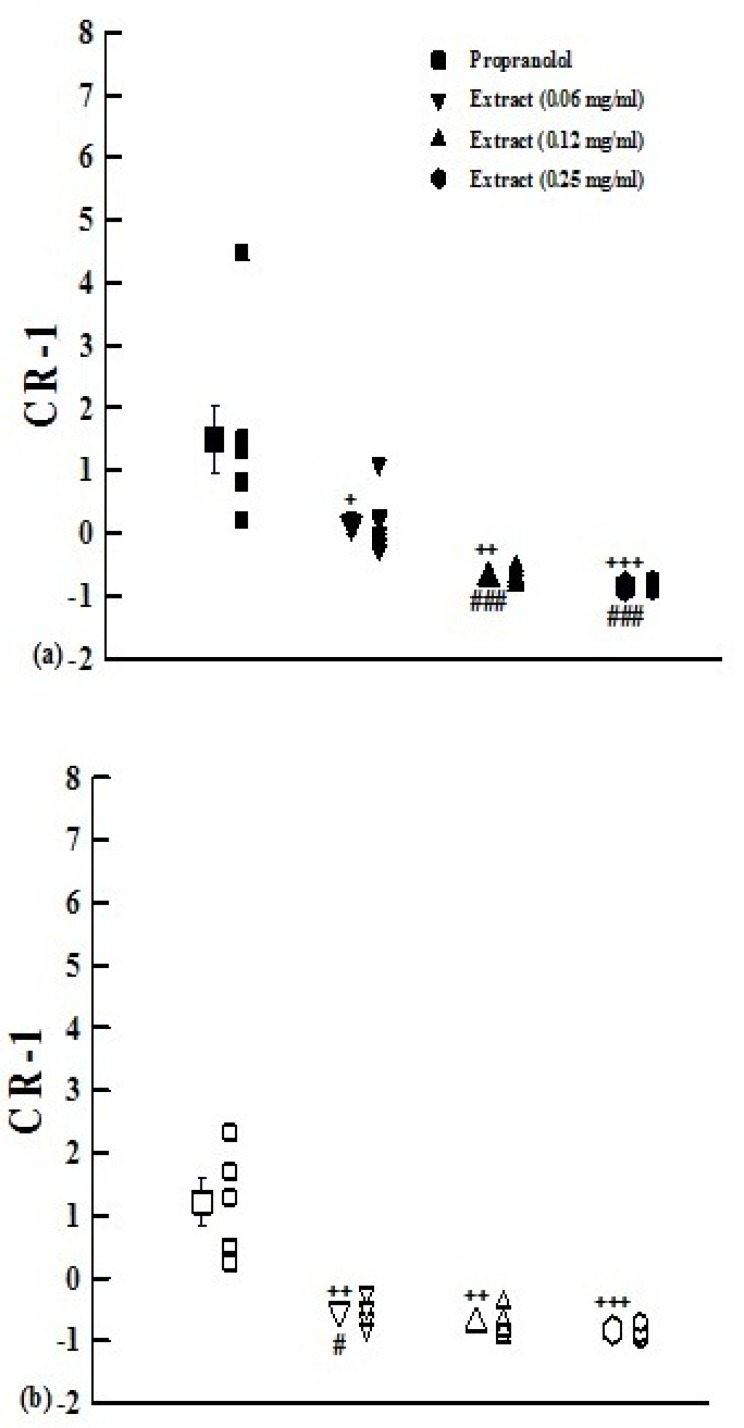
Figure 3.
The values of (CR-1) obtained in the presence of three concentrations of aqueous-ethanolic extract from P. olerace(0.06, 0.12, and 0.25 mg/mL) and 10 nM propranolol.Data are presented as mean±SEM. Group 1 (a) is on non-incubated (n=7), and group 2 (b) on incubated tissues with chlorpheniramine (n=5). +: p<0.05, ++: p<0.01, +++: p<0.001 compared with propranolol.#: p<0.05compared to non incubated tissues

