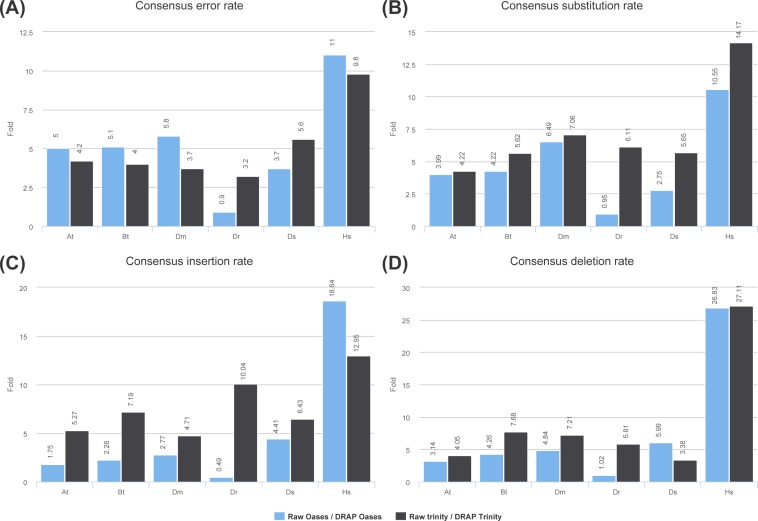
Figure 5. Consensus error rates.
(A) presents the ratio of the global error rates between raw and DRAP assemblies for each dataset (data from Table 2 colum 12). (B), (C) and (D) present the ratio of the error rates respectively for substitution, insertions and deletions between raw and DRAP assemblies for each dataset (data from Table S2).

