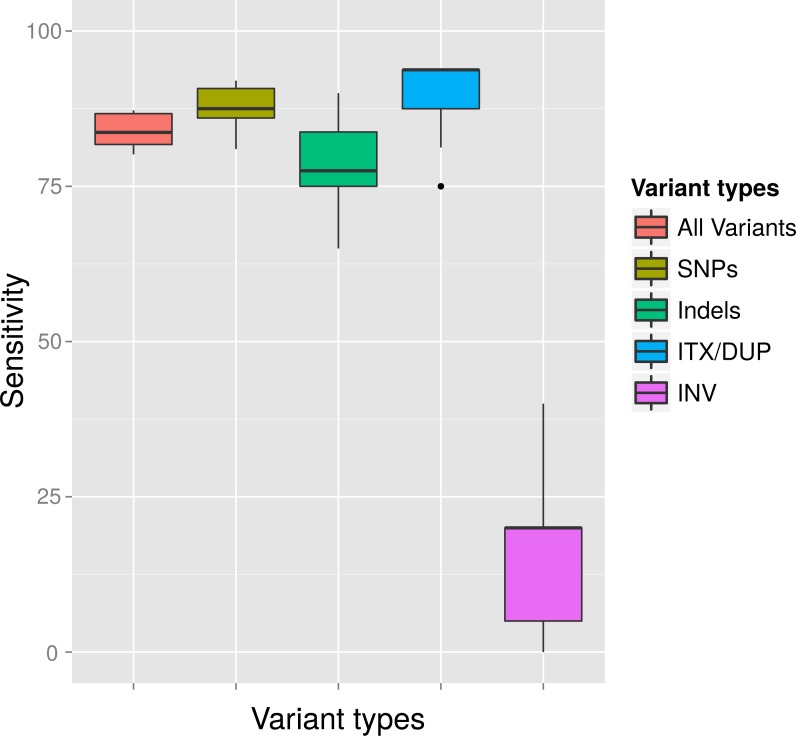
Figure 4. Average detection rates and standard deviation of all callers for variants simulated at a MAF of 4% and a MRA cutoff of 2%.
The variant detection rates are shown in percent for all variants (ALL), only SNPs (SNP), only InDels (IND), duplications and translocations (ITX/DUP) and inversions (INV). The results show the expected sensitivity of VarCap, as we use a MRA of 2% as a default setting to avoid false positives.

