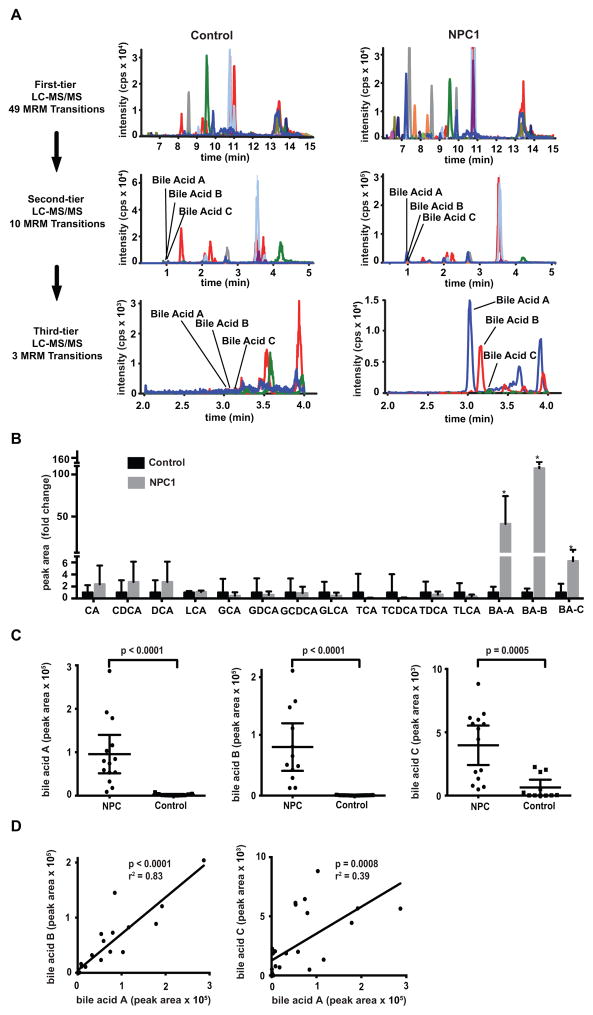
Fig. 1. NPC1 biomarker screening.
(A) Three-tier targeted metabolomics strategy for identification of bile acid biomarkers. First-tier screen includes 49 multiple reaction monitoring (MRM) transition (17 min run time). Second tier includes 10 MRM transitions (7.5 min run time) to characterize peaks with signal-to-noise ratio greater than five. Third tier (6 min run time) quantifies unknown bile acid peaks (A, B and C) that are elevated in NPC1 compared to control. (B) Comparison of bile acid concentration in NPC1 (n = 12) versus control (n = 11) samples obtained from second-tier profiling. Data are presented as mean fold-change + SD normalized to control. *P = 0.0005, 0.0003, 0.0007 for bile acid A, B, C in NPC1 versus controls, respectively. CA, cholic acid; CDCA, chenodeoxycholic acid; DCA, deoxycholic acid; LCA, lithocholic acid; GCA, glycocholic acid; GDCA, glycodeoxycholic acid; GCDCA, glycochenodeoxycholic acid; GLCA, glycolithocholic acid; TCA, taurocholic acid; TDCA, taurodeoxycholic acid; TCDCA, taurochenodeoxycholic acid; TLCA, taurolithocholic acid; BA-A, bile acid A; BA-B, bile acid B; BA-C, bile acid C. (C) Comparison of bile acids A, B and C in NPC1 (n = 12) and control (n = 11) plasma samples obtained from third-tier profiling. Data are presented as mean ± 95% CI peak area. P < 0.0001 for bile acids A and B in NPC1 versus controls. P = 0.0005 for bile acid C in NPC1 versus controls. (D) Correlation between bile acids A and B in NPC plasma samples, r2 = 0.83, P < 0.0001; correlation between bile acids A and C in NPC plasma samples, r2 = 0.39, P = 0.0008.

