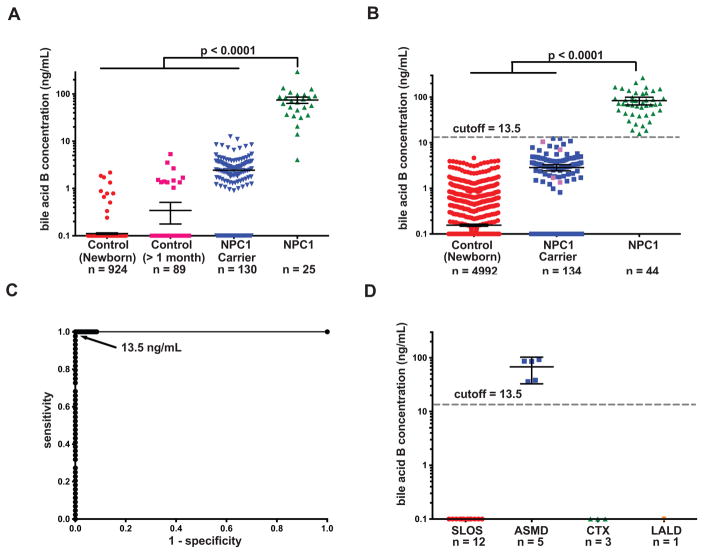
Fig. 6. Establishment and validation of cut-off for NPC1 newborn screen.
(A) Bile acid B concentrations in dried blood spots from newborn control, control at other age (> 1 month old), NPC1 carrier, and NPC1 patients in a training set. Bile acid B concentrations below the LLOQ (5 ng/mL) were quantifiable though the %CV and %RE for these samples were above acceptance criteria for the validated assay. Data presented on semi-log plots are shown as mean ± 95% CI. Samples with no detectable bile acid B peak were assigned as 0.1 ng/ml for purposes of plotting. P < 0.0001 for NPC1 versus controls and NPC1 carriers. (B) Determination of bile acid B concentrations and application of the 13.5 ng/mL cut-off to a test sample set consisting of newborn control, NPC1 carrier, and NPC1 dried blood spots. All newborn control and NPC1 samples are new samples, and carriers denoted by pink symbols are new samples. Samples were coded, randomized and the operator blinded to group assignment, thus reducing bias and noise/variance in the results and enabling unbiased statistical analysis of the data. Data are presented on semi-log plots and are shown as mean ± 95% CI. Samples with no detectable bile acid B peak were assigned as 0.1 ng/ml for purposes of plotting. P < 0.0001 for NPC1 versus controls and NPC1 carriers. (C) Application of cut-off value of 13.5 ng/mL yields sensitivity and specificity of 100%, and ROC area under the curve of 1.0. The NPC1 carriers in blue were analyzed in training set and re-analyzed in validation set. (D) Bile acid B concentrations in SLOS, ASMD, CTX, and LALD dried blood spots from cut-off validation sample set. Data are presented on semi-log plots and are shown as mean ± 95% CI. Samples with no detectable bile acid B peak were assigned as 0.1 ng/ml for purposes of plotting. P < 0.0001 for ASMD versus controls.

