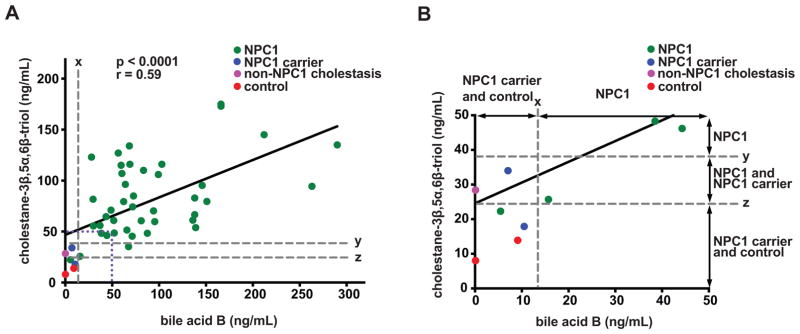
Fig. 7. Comparison of bile acid B in dried blood spots with cholestane-3β,5α,6β-triol in plasma.
(A) Correlation of bile acid B in dried blood spots with cholestane-3β,5α,6β-triol in plasma (n = 47), r = 0.59, P < 0.0001. x, bile acid cutoff for NPC1 carriers and controls; y, cholestane-3β,5α,6β-triol cutoff for NPC1 carriers; z, cholestane-3β,5α,6β-triol cutoff for controls. (B) The inset bounded by the dotted purple line in panel (A) has been expanded to more clearly compare assay specificity.

