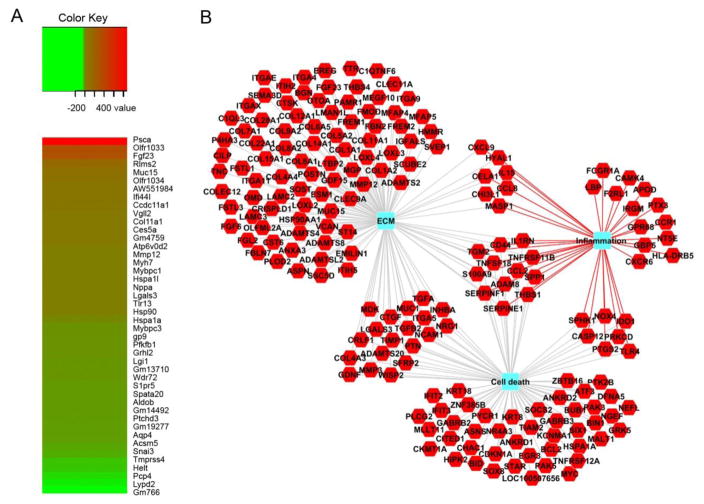
Fig. 7. Differentially regulated genes in DCM compared to WT hearts.
(A) RNA-Seq heat maps depicting clusters of genes differentially regulated in DCM versus WT hearts. Shown is a subset of the most upregulated (red) and downregulated (green) genes from the total gene set. The fold change, up or down, is represented in the keys for the respective panels. n = 3 pooled samples per genotype. (B) Network of significantly enriched gene ontology terms for upregulated genes in DCM hearts. The red hexagons denote upregulated genes in DCM compared to WT hearts. Blue rectangles represent significantly enriched (p < 0.05; FDR) biological processes using the ToppFun application of ToppGene Suite.

