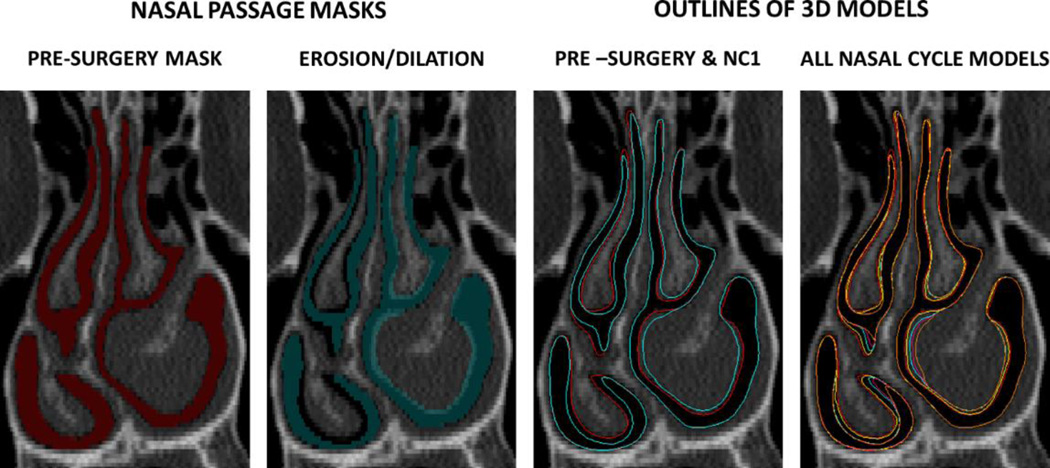
Figure 3.
Creation of nasal cycle models. The turbinates were reduced in the left cavity and dilated on the right cavity. This process was repeated in systematic steps to create several nasal cycle models (red=pre-surgery, yellow=NC1, blue=NC2, pink=NC3, orange=NC4). The NC1 model (yellow) represents the smallest change, while the NC4 model (orange) represents the greatest change as compared to the pre-surgery model.

