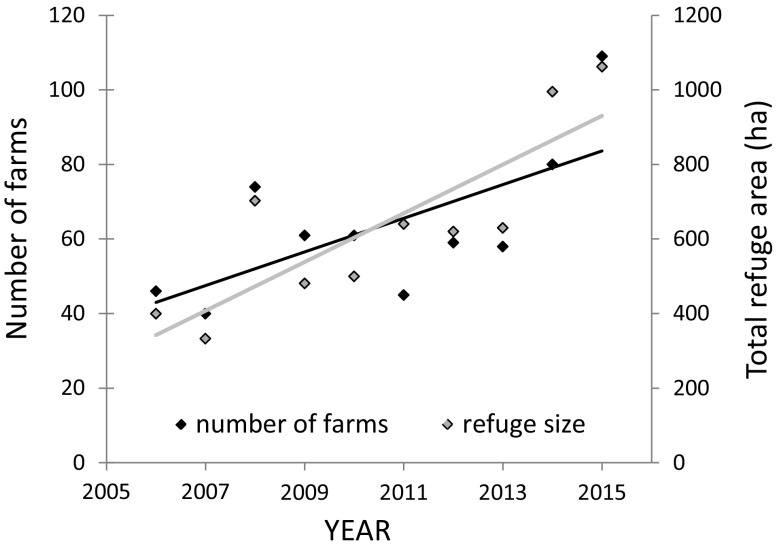
Fig. 2.
The number of farms involved in a goose subsidy scheme (black squares) and the total size of refuges (grey squares) in the county of Nord-Trøndelag, mid-Norway, over the period 2006–2015. There is a significant increase for both variables (linear regressions: number of farms (black line): r 2 = 0.45, n = 10, P = 0.033, refuge size (grey line): r 2 = 0.70, n = 10, P = 0.003)

