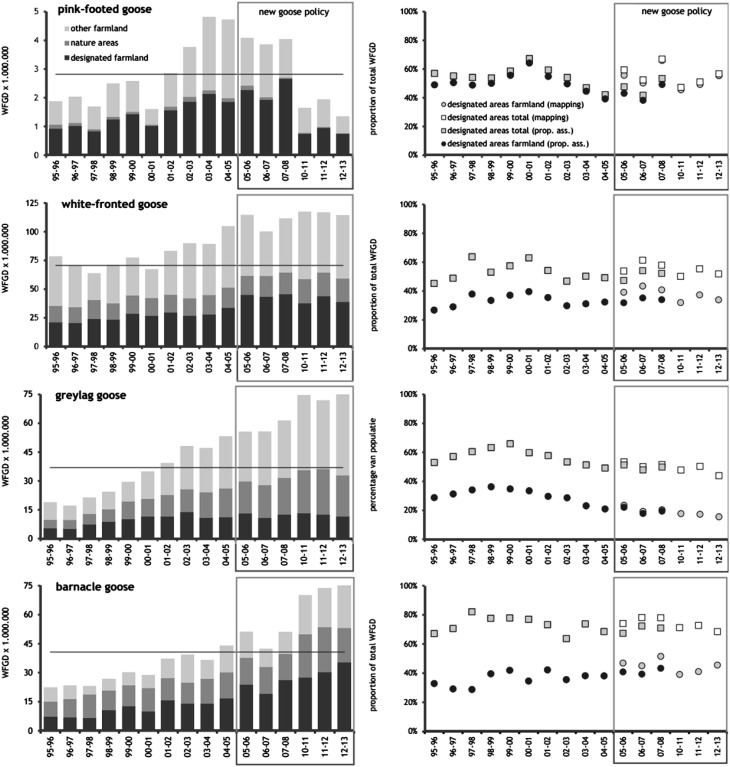
Fig. 2.
Trends in the use of goose foraging areas prior to and during the new management scheme. Left panels white-fronted goose days (WFGD) spent in designated goose foraging areas in farmland and in nature reserves, and in ‘other’ farmland not designated as foraging areas. Grey boxes indicate the period of the new management policy, and the horizontal line indicates the number of WFGD on which the carrying capacity of 80 000 hectares was based (Ebbinge and Rossum 2004). The right panels show the proportions of WFGD spent in designated goose foraging areas, on farmland and on both farmland and nature reserves, calculated on the basis of mapping of flocks (new policy period only) and using the proportional assignment method (‘prop. ass.’; see “Materials and methods” section)

