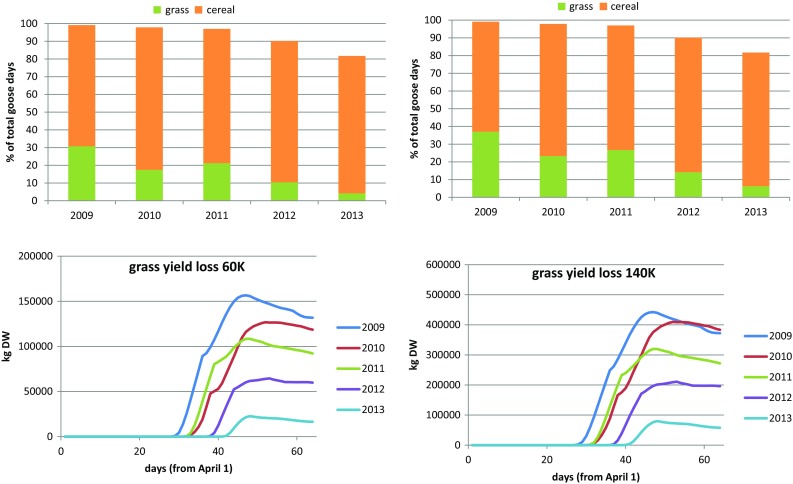
Fig. 4.

(top) Percentages of accommodated goose days on barley cereal fields and grassland, for maximum population size 60 000 (left) and 140 000 (right), combined with each weather dataset. (bottom) Grass yield loss dynamics for 60 000 (left) and 140 000 (right) population size, for all weather sets. Reference case with all fields available
