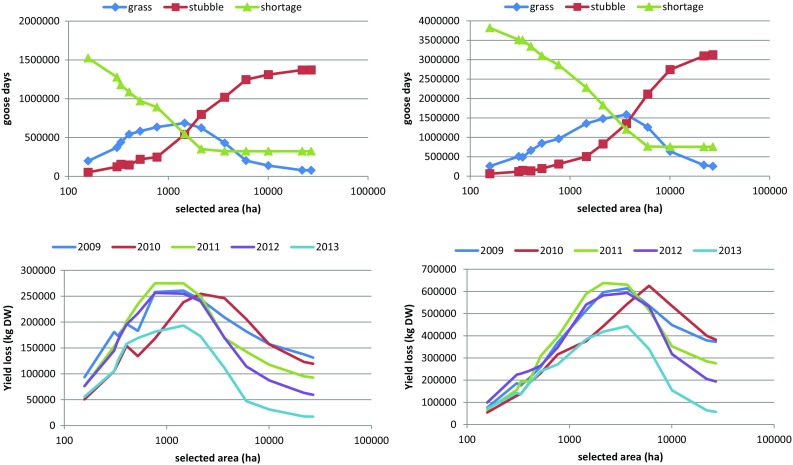
Fig. 5.

(top) Numbers of goose days accommodated on grassland and barley cereal fields, and shortages, using the 2013 weather dataset (see Fig. 2). (bottom) Yield loss at the end of the staging period (day 64), depending on refuge area, for all the 5 weather datasets
