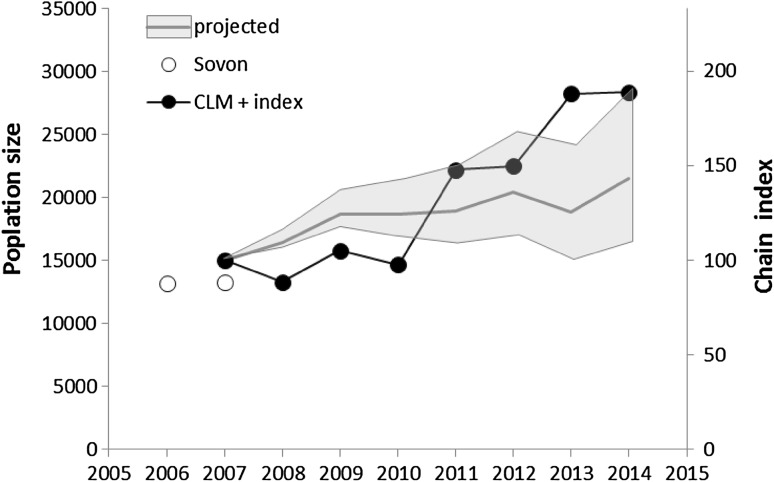
Fig. 7.
Counts (filled and open circles) and projected size (shaded area) of the barnacle goose population in the Northern Delta area. Population projection is based on a simple population model assuming survival varying by age and year and a constant fecundity of 0.2 females per female (see text), and lower and upper limits of 0.15 and 0.25, respectively

