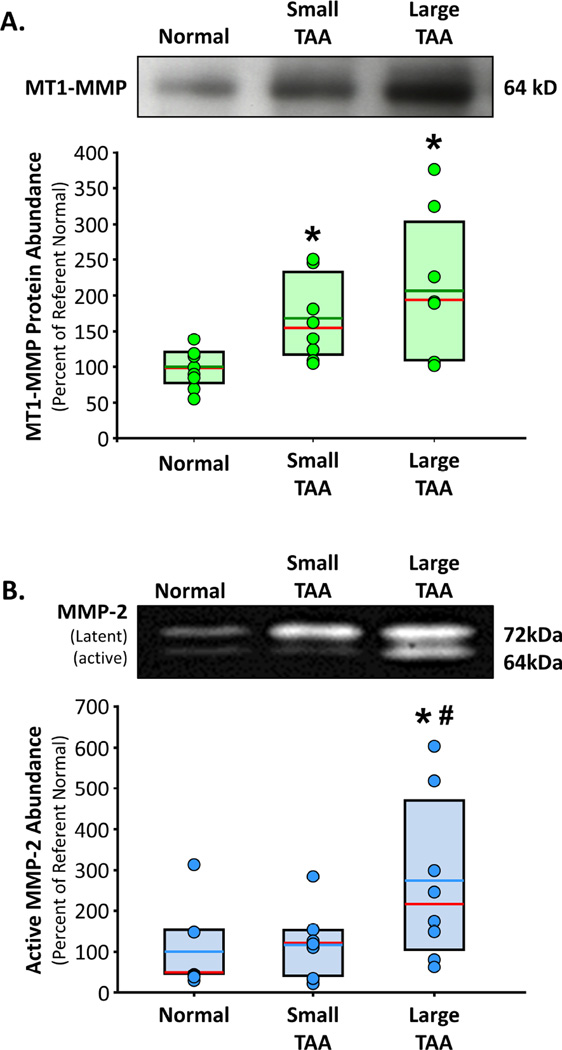
Figure 1. MT1-MMP and MMP-2 abundance in clinical TAA specimens.
A. Top. Representative immunoblot showing MT1-MMP protein abundance in normal aorta (n=8), small TAA (4.0 – 4.9 cm; n=8), and large TAA (6.5 – 8.0 cm; n=8). Bottom. Densitometric quantitation of MT1-MMP protein abundance determined by immunoblotting. Results are expressed as a mean percent change of normal aorta. Individual data points in each group overlay box plots. The box defines the 25th–75th interquartile range, and both the median (red line) and mean (green line) values are shown within the box. * p<0.05 versus Normal (ANOVA with Tukey’s wsd). B. Top. Representative zymogram showing the protein abundance of the latent form (72kD band) and active form (64kD band) of MMP-2 in normal aorta (n=7), small TAA (4.0 – 4.9 cm; n=8), and large TAA (6.5 – 8.0 cm; n=8). Bottom. Densitometric quantitation of active (64kD band) MMP-2 protein abundance determined by gelatin zymography. Results are expressed as a mean percent change of normal aorta. Individual data points in each group overlay box plots. The box defines the 25th–75th interquartile range, and both the median (red line) and mean (blue line) values are shown within the box. * p<0.05 versus Normal, # p<0.05 versus Small TAA (ANOVA with Tukey’s wsd).

