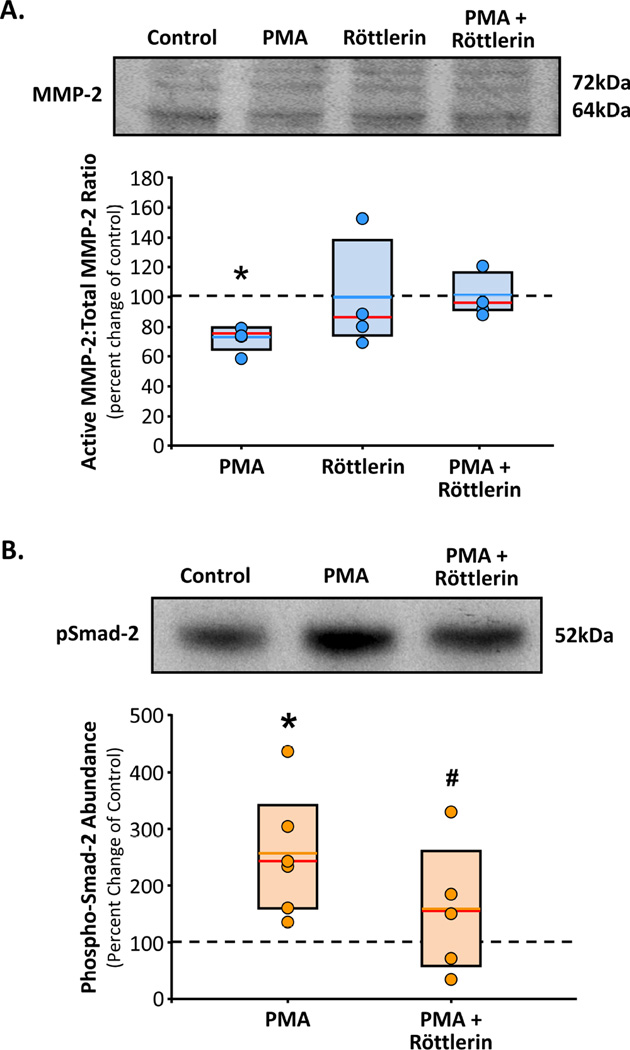
Figure 5. PMA induced changes in MT1-MMP function.
A. Primary aortic fibroblasts from normal mice (n=4) were treated with or without PMA, in the presence or absence of Röttlerin for 18 h (n=4 each treatment group). Cell homogenates were fractionated by gel electrophoresis and immunoblotted for latent and active MMP2. Results are expressed as a mean percent change in each cell line from its respective steady-state control (vehicle treated; dotted line). Individual data points in each group overlay box plots. The box defines the 25th–75th interquartile range, and both the median (red line) and mean (blue line) values are shown within the box. * p<0.05 versus control (ANOVA with Tukey’s wsd). B. Primary aortic fibroblasts from normal mice (n=4) were treated with or without PMA (30 min), in the presence or absence of Röttlerin (3 h pre-incubation, plus 30 min concurrent; n=4 each treatment group). Cell homogenates were fractionated by gel electrophoresis and immunoblotted for phosphor-Smad-2. Results are expressed as a mean percent change in each cell line from its respective steady-state control (vehicle treated; dotted line). Individual data points in each group overlay box plots. The box defines the 25th–75th interquartile range, and both the median (red line) and mean (orange line) values are shown within the box. * p<0.05 versus control, # p<0.05 versus PMA (ANOVA with Tukey’s wsd).

