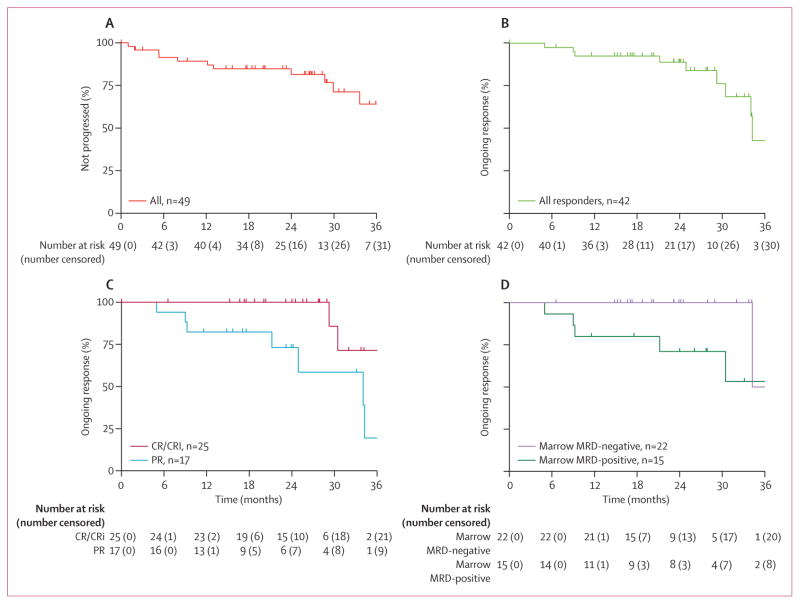
Figure 2. Durability of response.
(A) Time to progression for all 49 enrolled patients (13 patients had events). (B) Duration of response for all 42 responders (nine patients had events). (C) Duration of response by overall response category: complete response or complete response with incomplete marrow recovery (CR/CRi; n=25, two patients had events) versus partial response (PR; n=17, seven patients had events). (D) Duration of response in patients negative for minimal residual disease (MRD) at 7 months (n=22, one patient had an event) versus patients who had minimal residual disease at 7 months (n=15, five patients had events) status. Tick marks on the curves indicate patients censored for each outcome measure.

