
Fig 2.
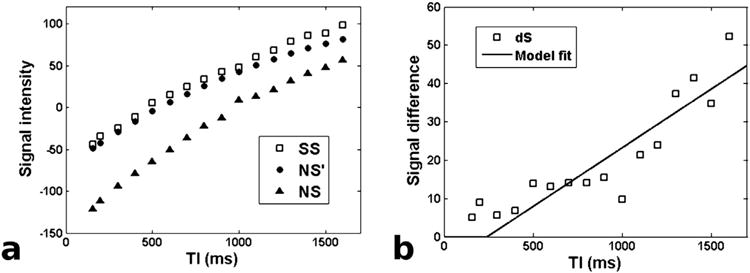
Demonstration of the proposed method for extracting perfusion from multi-TI ASL data. a) Example SS and NS signals from the renal cortex. The black circles (NS') mark the NS signals that were reconstructed to correct for the imperfect-inversion artifact. b) The multi-TI difference signal dSn is the difference between the SS and NS' signal curves normalized by T1 relaxation. The solid line is the fit of our proposed model to the data.