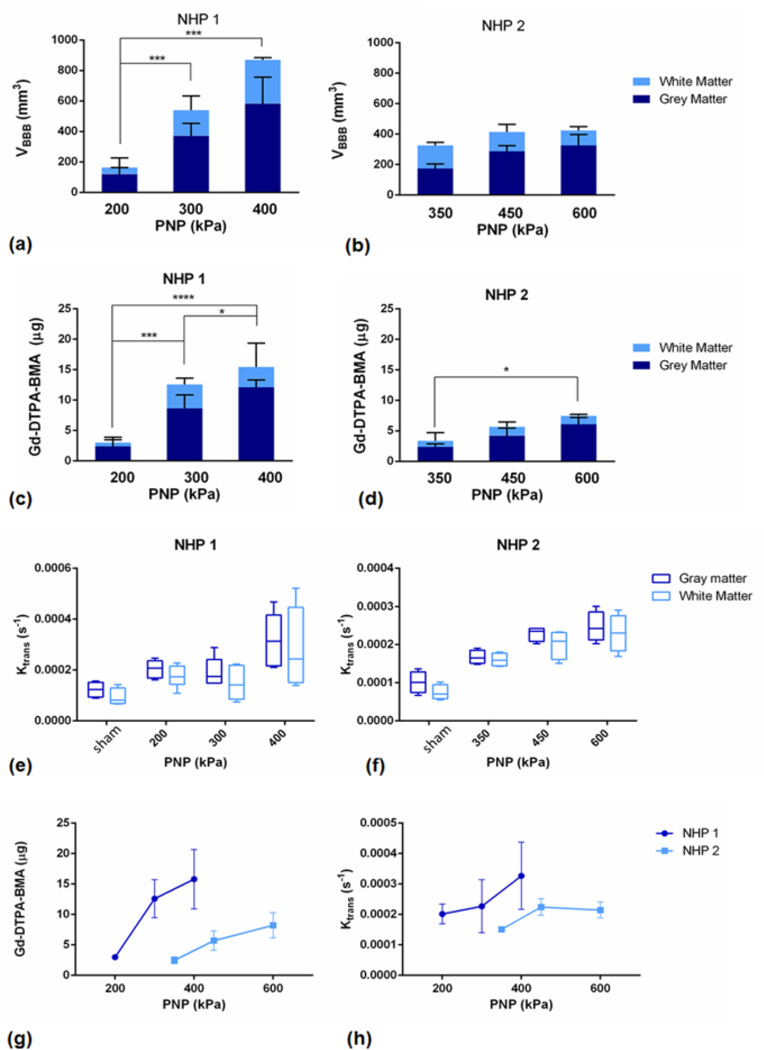
Figure 6.
Volume of opening (VBBB) in NHP 1 in the GM and WM. Two asterisks (**) denote p<0.01, three asterisks (***) denote p<0.001 and was detected between the lowest and the highest pressure (600 kPa). VBBB was increased in the GM, compared to the WM. (b) VBBB in NHP 2 is shown, in the GM and WM. (c) Total amount of gadoloinium (Gd-DTPA-BMA) in NHP 1, divided in the amount detected in the GM and the WM, and in NHP 2 in (d). (e) Boxplots of the average Ktrans in NHP 1, showing the background Ktrans of the brain in the GM and WM, and in NHP 2 in (f).

