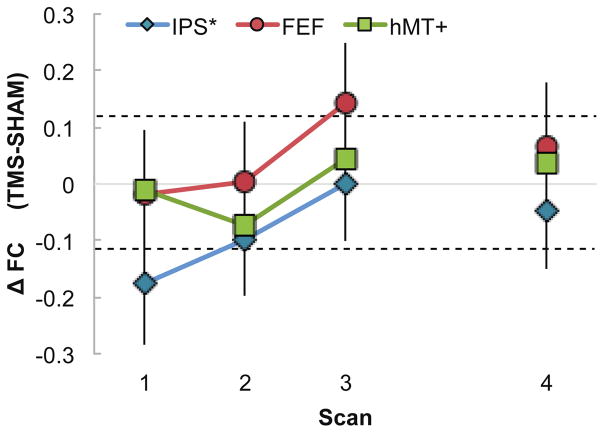
Figure 2. Interhemispheric FC across time.
Functional connectivity difference between homotopic areas in the left (stimulated) and right hemisphere (Sham FC was subtracted from TMS FC). Colored symbols indicate the three areas: IPS (Intraparietal Sulcus, blue diamonds), FEF (Frontal Eye Field, red circles) and hMT+ (human Middle Temporal Area, green squares). While the first three runs were collected in close succession (Scans 1, 2 and 3 on the x-axis), scan 4 was collected approximately 48 minutes from the end of stimulation, following an intermediate run during which subjects rested while watching a video clip of a popular movie. Values above the dashed lines indicate statistically significant difference (between Sham and TMS), determined using a the bootstrap Monte Carlo procedure. FC between left and right IPS significantly decreased during Scan 1 and slowly recovered in Scan 2. FC between left and right FEF significantly increased during Scan 3, over 30 minutes after the end of stimulation.

