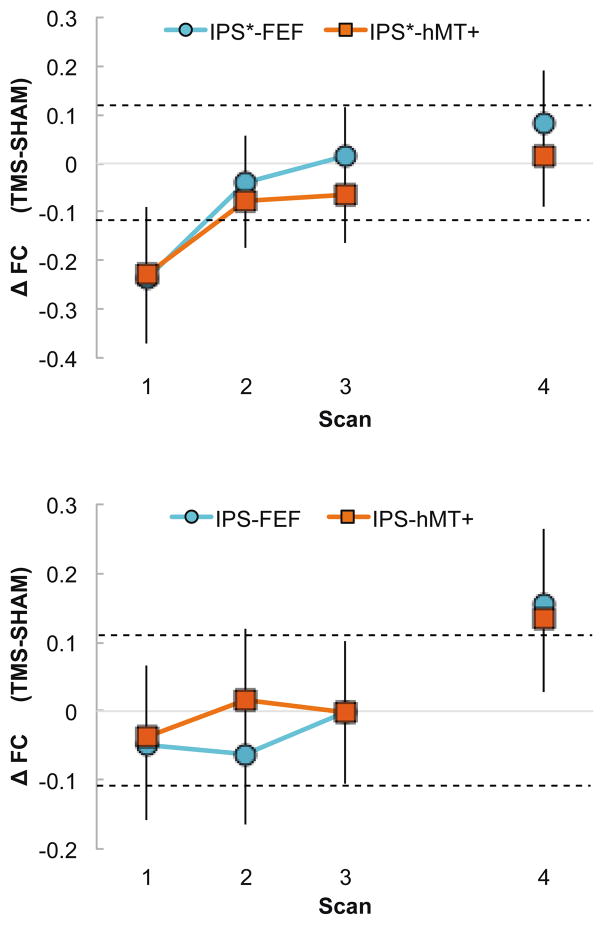
Figure 3. Intrahemispheric FC across time.
Intrahemispheric impact of rTMS on FC within the left hemisphere (a. stimulated) and the right hemisphere (b. unstimulated). FC scores reflect the change in functional connectivity in the TMS condition as compared to Sham. A) FC between the left IPS and the left FEF (blue circles) and between the left IPS and left hMT+ (red squares) immediately and significantly decreased during Scan 1 (dotted line indicates significant difference) and recovered starting from Scan 2, 3 and 4. B) FC between the right IPS and the right FEF (blue circles) as well as between the right IPS and right hMT+ (red squares) significantly increased around 48 minutes after the end of stimulation, during Scan 4.

