Figure 1.
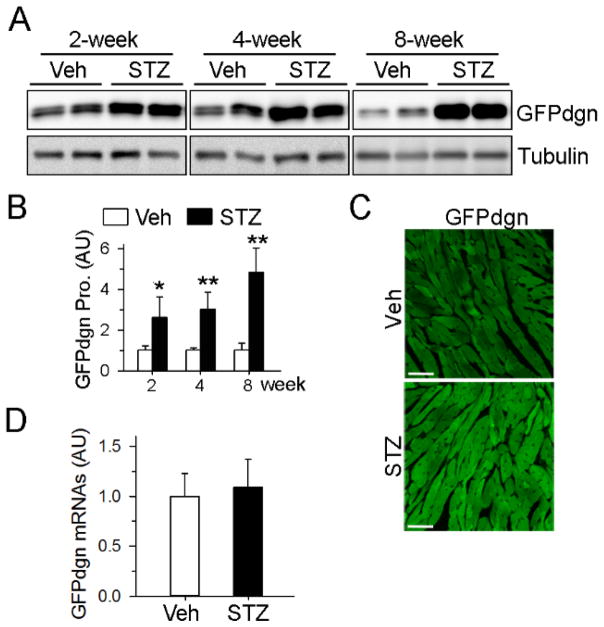
Accumulation of GFPdgn proteins in hearts of diabetic mice. A, Western blots showed progressively increased cardiac GFPdgn levels after diabetes induction. B, Quantification of (A), n=4 per group. *P<0.05, ** P<0.01 versus vehicle (Veh). C, Confocal microscopy analysis revealed increased direct GFP fluorescence (green) in myocardial sections 4 weeks after STZ injections. Bar, 50 μm. D, Quantitative real-time PCR analysis showed no change in levels of GFPdgn transcripts in diabetic hearts 2 weeks after STZ treatment.

