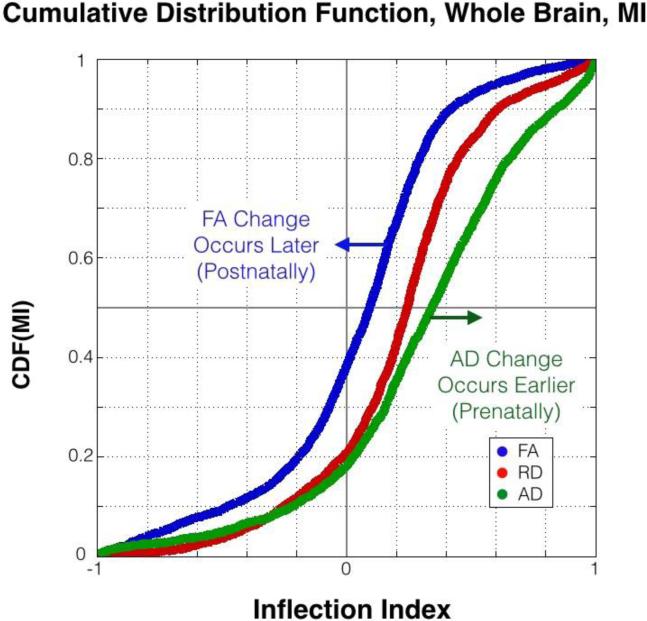
Figure 3. Explanatory Power Increase as a Function of Maturation Index.
The increase in explanatory power when separating PM into GA and SA is plotted against MI. MI reflects the change in estimated rates of change after birth relative to the estimated rate before birth. A large difference in slopes before and after birth results in a large magnitude MI and large increase in explanatory power when considering GA and SA as independent variables.

