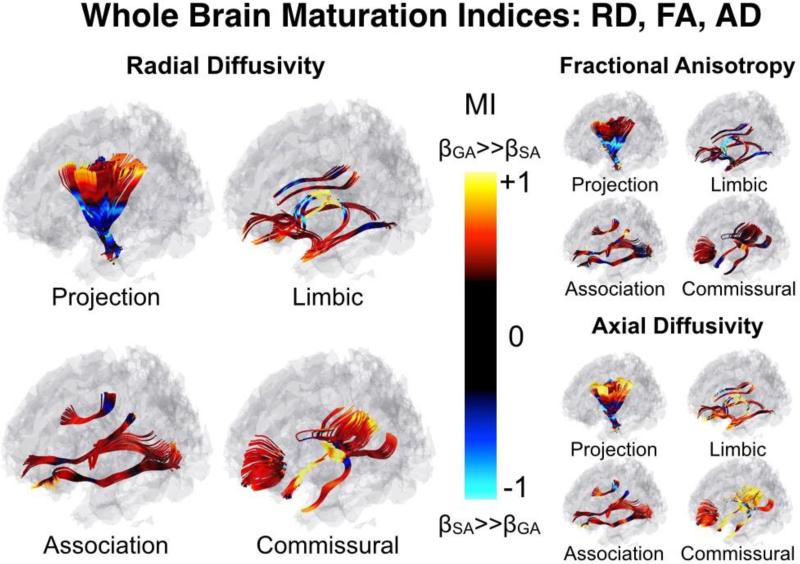
Figure 5. Whole Brain Maturation Index Map.
White matter tracts are separated by group: Projection (Inferior-Superior), limbic (limbic connections), association (anterior-posterior), and commissural (left-right). Note the large negative MIRD in the inferior projection fibers (internal capsule), and large positive MIRD in the more peripheral ends of the tract. MIRD is emphasized, here, as it is predictive of both MIFA and MIRD (see figures 6 and 7). One-dimensional tract-based statistics are projected onto the three-dimensional streamlines for visualization purposes.

