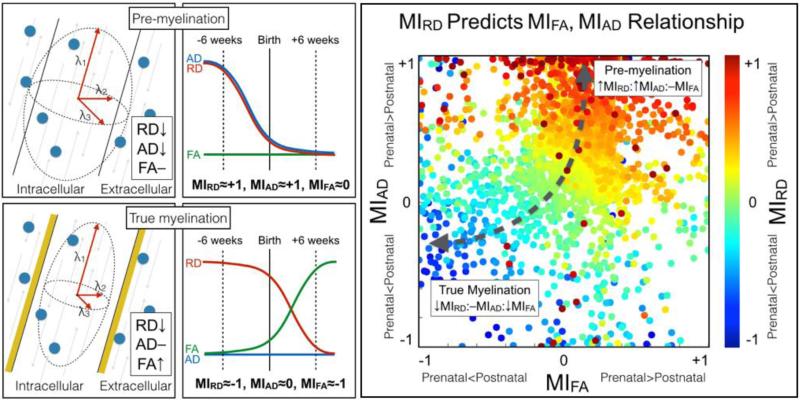
Figure 7. The inter-relationship bewteen MIRD, MIAD and MIFA.
Left panel set: DTI model of pre- and true myelination (far left panels) and a cartoon depiction of pre-myelination occurring before birth and true myelination occurring after birth (middle two panels). Note the process-dependence of FA, RD and AD (far left) as well as the hypothesized values for MIFA, MIRD, and MIAD (middle). Far right panel: MIRD predicts the relationship between MIFA and MIAD. As expected, the majority of data points are found to have a large positive MIRD, large positive MIAD and null MIFA. A large cluster of data points with large negative MIRD, large negative MIFA and roughly null MIAD, were found in regions known to show early signs of myelin.

