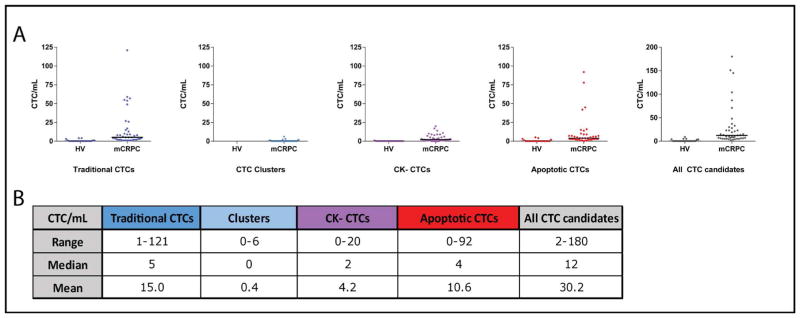
Figure 3. CTC incidence in mCRPC patient samples compared to healthy volunteers (HV).
A. The number of traditional CTCs, CTC clusters, CK− CTCs, apoptotic CTCs and all CTC candidates (traditional, clusters, CK−, and apoptotic CTCs)/mL identified in HV and mCRPC patient samples are plotted. Black lines indicate the median CTCs/mL. B. Range, median, and mean CTCs/mL in mCRPC patient samples for all categories are given.

