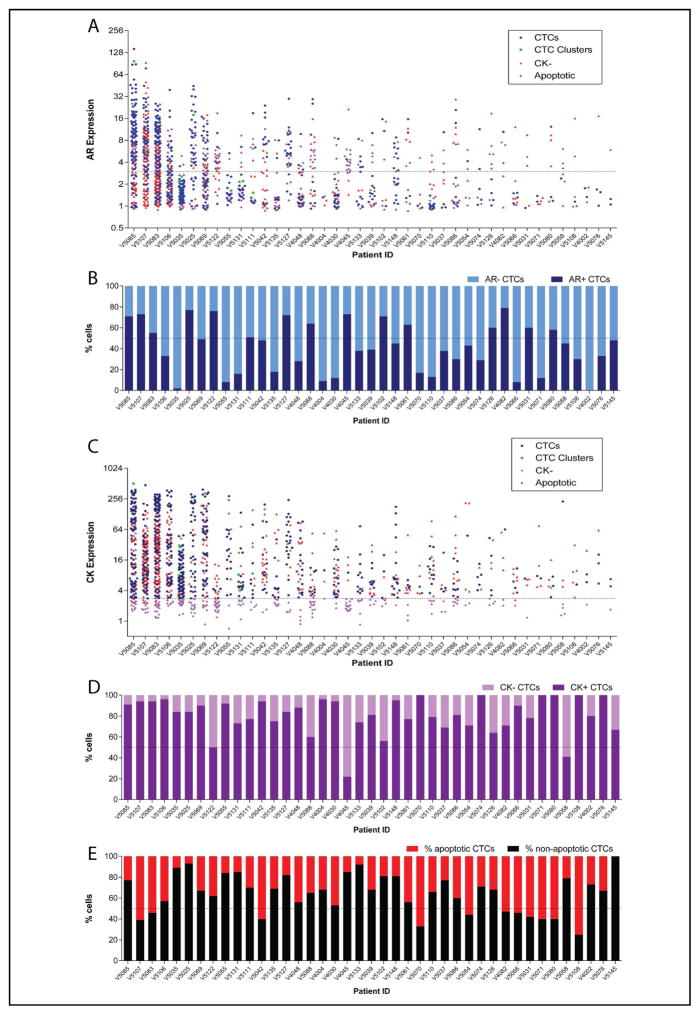
Figure 4. AR and CK expression by immunofluorescence varies across traditional and non-traditional CTCs in mCRPC patient samples.
AR (A&B) and CK (C&D) intensity distribution across traditional and non-traditional CTCs per patient. The dashed lines at 3 (A) and 2.8 units (C) indicate the cut-off for AR and CK positivity, respectively. Charts B and D show the percentage of all CTCs/mL (traditional and non-traditional) with or without B) AR or D) CK expression per patient. E. The percentage of apoptotic and non-apoptotic CTCs/mL per patient.

