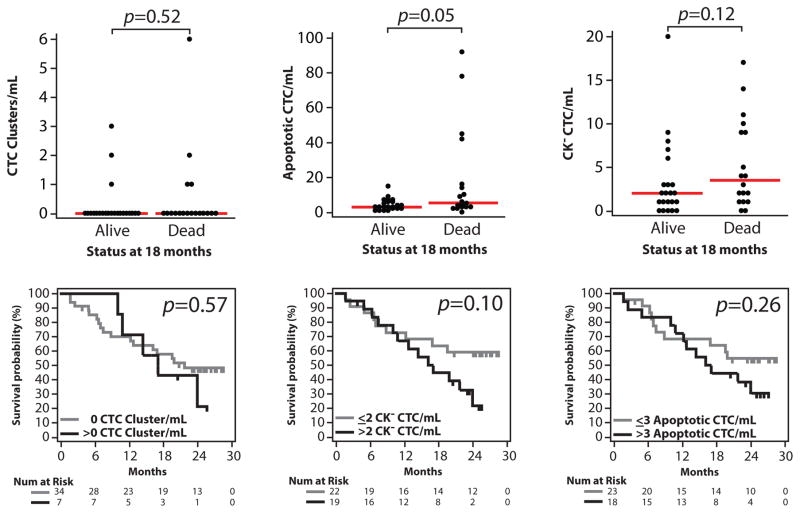
Figure 7. Associations of non-traditional CTC/mL counts in patients with mCRPC and overall survival.
A. Individual non-traditional CTC type counts (CTC clusters, CK− CTCs and apoptotic CTCs) stratified by patient status (dead vs. alive) at 18 months are plotted (40 of 41 patients evaluable at that time point). p values from Mann-Whitney tests are shown. D. Kaplan-Meier analysis for CTC clusters, CK− CTCs and apoptotic CTCs and overall survival time for all 41 patients. For each CTC type, patients were stratified by having > or ≤ median CTC count/mL. Log-rank test p values are shown.

