Fig. 3.

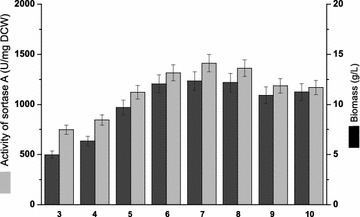
Effect of initial pH on the expression of SrtA. Light gray and dark gray bars represent the SrtA activities and biomasses in the medium with different initial pH values

Effect of initial pH on the expression of SrtA. Light gray and dark gray bars represent the SrtA activities and biomasses in the medium with different initial pH values