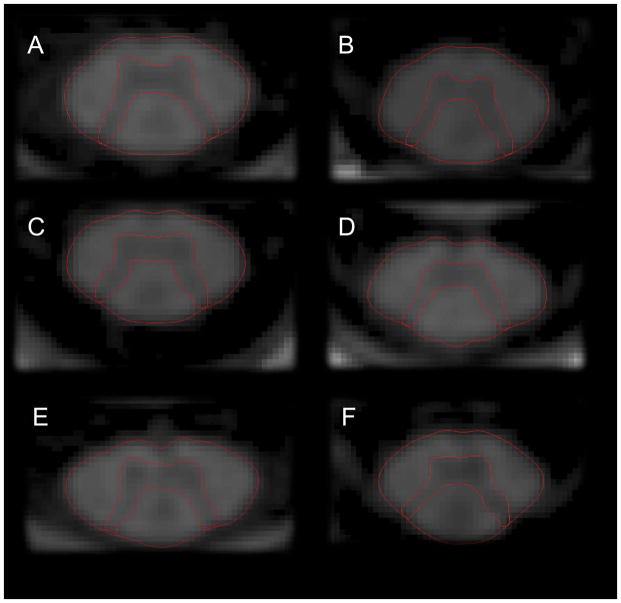
Figure 2.
A–F. Axial 2D-phase sensitive inversion (PSIR) images at the C2/C3 disc level of patients with RRMS and EDSS < 2.0 (A, C, E) and patients with primary progressive (B), and secondary progressive MS (D, F) illustrating GM atrophy in progressive MS. Notice the selective atrophy of the spinal cord GM in the patient with progressive MS and moderate disability (EDSS 4.0) (B) and both WM and GM atrophy in severely disabled secondary progressive MS of long disease duration (F).

