
Figure 3.
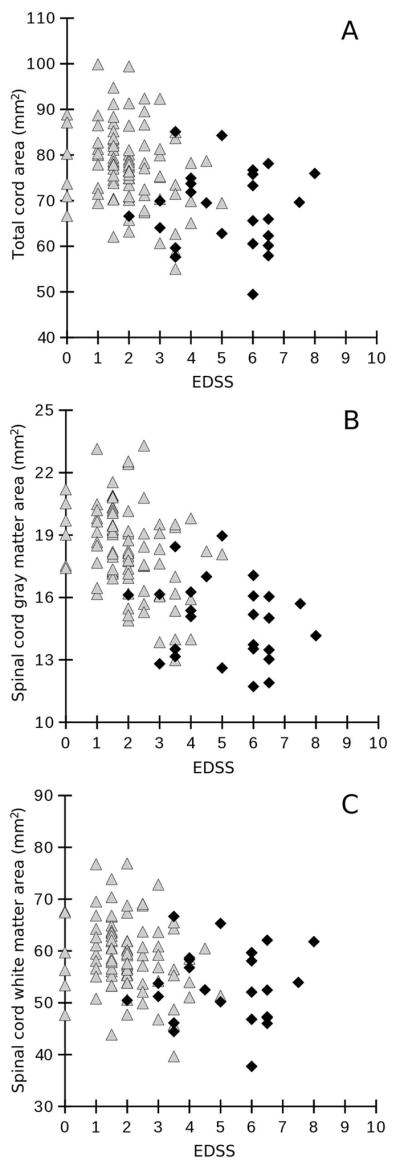
Associations between the Expanded Disability Status Score (EDSS) (x-axis) and (A) total spinal cord area, (B) mean spinal cord gray matter area, and (C) spinal cord white matter area (given in mm2, y-axis) using Spearman rank correlation. Correlation coefficients are A: rho=−0.42, p<0.001; B: rho=−0.60, p<0.001; C: rho=−0.32, p=0.001. Measurements were taken at the C2/C3 intervertebral disc level. White triangles represent relapsing MS patients, black diamonds represent progressive MS patients.