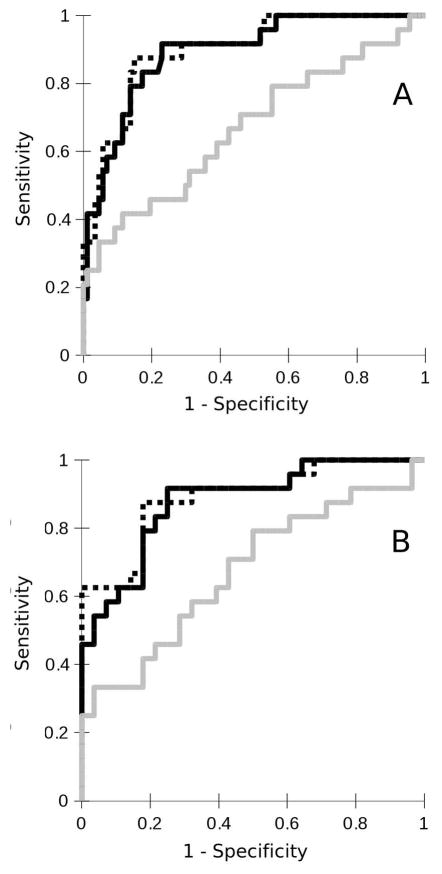
Figure 6.
Receiver operating characteristic (ROC) curve displaying the sensitivities and specificities to classify (A) a progressive vs. relapsing disease course and (B) a progressive vs. mild disease course based on binary logistic models based on either brain gray matter (GM) volume (light gray curve) or spinal cord (SC) GM area (dark gray curve) or both (dotted black line). The areas under the curve were (A) 0.69, 0.89 and 0.90, respectively and (B) 0.67, 0.88 and 0.89, respectively.

