Figure 2.

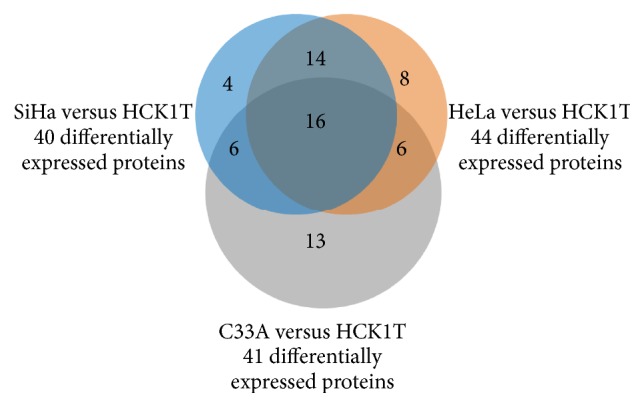
Venn diagram depicting the common proteins between the different comparisons (SiHa versus HCK1T, HeLa versus HCK1T, and C33A versus HCK1T).

Venn diagram depicting the common proteins between the different comparisons (SiHa versus HCK1T, HeLa versus HCK1T, and C33A versus HCK1T).