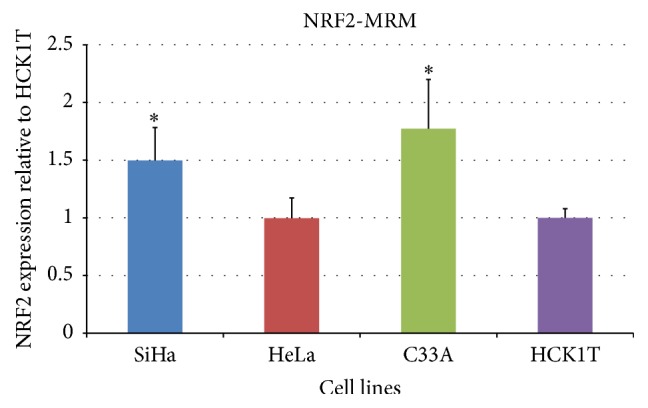
Figure 7.

Confirmation of the IPA-predicted NRF2 activation in cancer cell lines by Multiple Reaction Monitoring (MRM). MRM analysis, performed in three different cell extracts from SiHa, HeLa, C33A, and HCK1T cells, corresponding to three biological replicates. One hundred μg of protein was used for sample preparation. NRF2 fold expression (light to heavy peptide ratio) was assessed relative to HCK1T. The relative NRF2 expression for SiHa, HeLa, and C33A cell lines was 1.5 ± 0.3 (p < 0.05), 1.0 ± 0.2 (p > 0.05), and 1.8 ± 0.4 (p < 0.05) compared to HCK1T, respectively. Graphical representation of the results (mean ± SD) is shown (∗p < 0.05, Student's t-test).
