
Fig. 3.
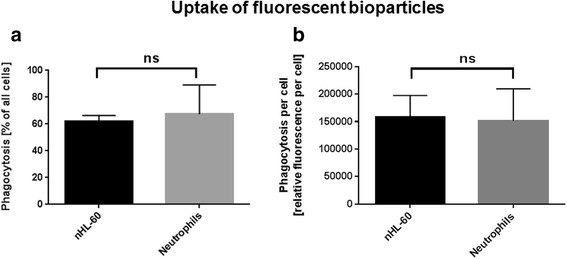
Uptake of fluorescent S. aureus bioparticles by nHL-60 cells and blood-derived neutrophils. This figure shows the uptake of fluorescently labeled S. aureus bioparticles by 3 day DMSO-differentiated nHL-60 cells and primary neutrophils, indicated as percentage of phagocytosis (a) or relative phagocytosis per cell (b). Results from three independent experiments are depicted as mean and SEM (n = 3). Comparison between primary neutrophils and nHL-60 cells was performed by unpaired, two-tailed t-test; *P < 0.05; ns = not significant