Figure 4.

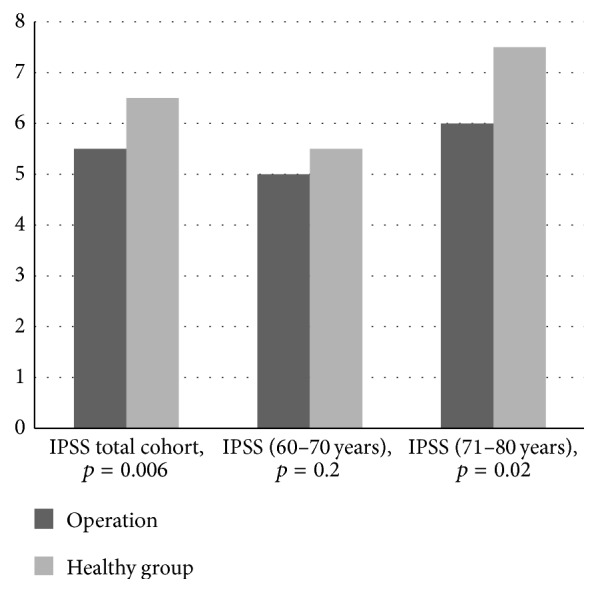
IPSS in the RPE and control group. The differences in the total (p = 0.002) and the 71–80 yrs (p = 0.02) group were significant.

IPSS in the RPE and control group. The differences in the total (p = 0.002) and the 71–80 yrs (p = 0.02) group were significant.