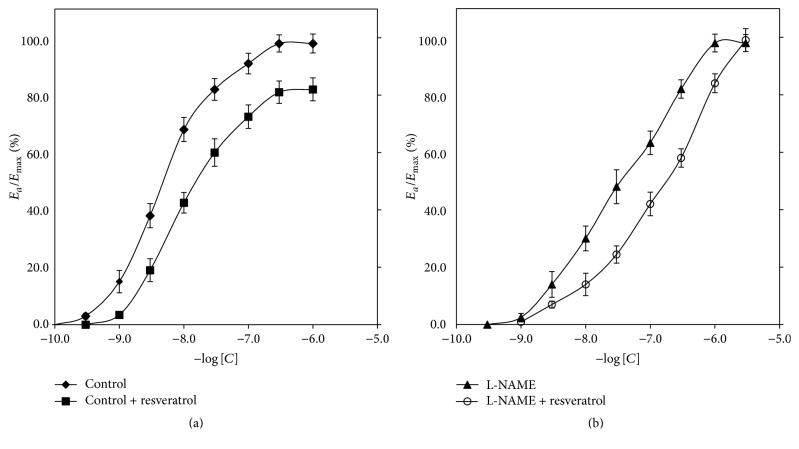
Figure 2.
Concentration-response curves in arteries with vascular endothelium obtained for phenylephrine in control and the resveratrol pretreated group (a); solely L-NAME and L-NAME with the presence of resveratrol (b). “Control” group serves as the control for “resveratrol” group (a), whereas “L-NAME” group serves as the control for “L-NAME + Resveratrol” group (b). Points and whiskers display mean values ± standard deviations. “Control” curve derived to represent a control curve for resveratrol. Ea/Emax: % of maximal response; ∗a value of p < 0.05 when comparing the control curve for points of effect between 20% and 80% of the maximal response.

