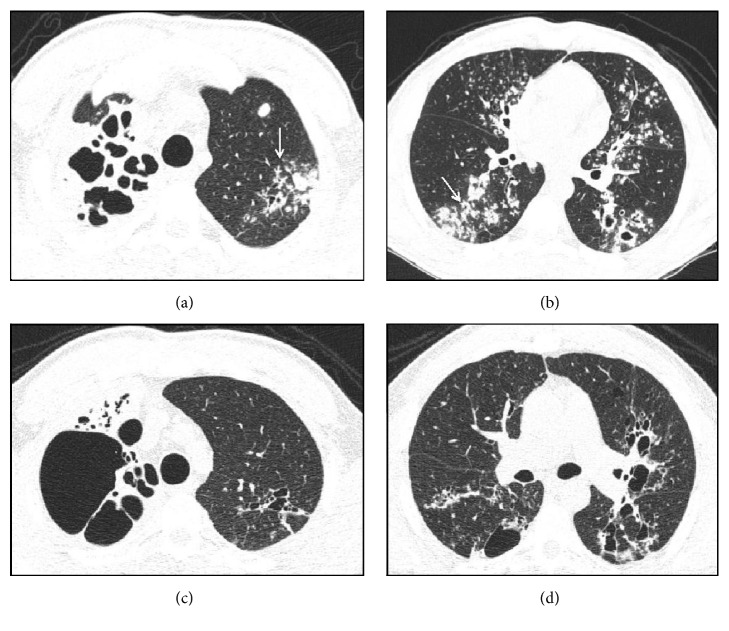
Figure 1.
Computed tomography findings in TB. Axial views ((a) and (b)) before treatment indicating the presence of extensive areas of parenchymal damage characterized by cavitary lesions and bronchiectasis on the right in addition to larger grouped nodules and airway nodules configuring the tree-in-bud pattern, with some resembling a clover on the left (arrows). (c) and (d) represent sections obtained after treatment indicating the presence of gross residual changes characterized by bubbles and bronchiectasis intermingled with areas of fibrosis.

