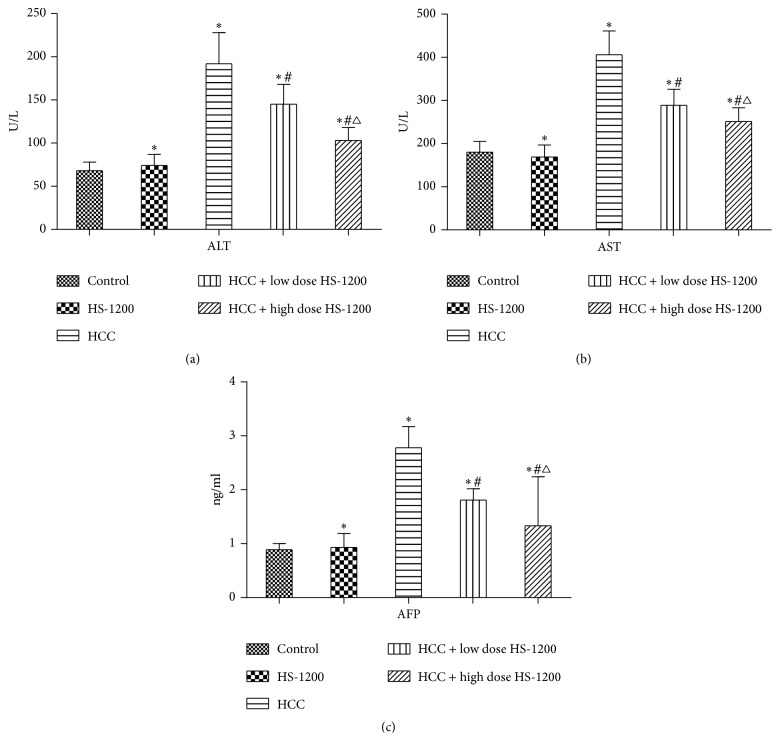
Figure 6.
Serum ALT, AST, and AFP levels of study groups. (a) Serum ALT; (b) serum AST; (c) AFP. Data expressed as mean ± SD. ∗P < 0.05 versus control; #P < 0.05 versus HCC; △P < 0.05 versus HCC + low dose HS-1200. ALT, alanine aminotransferase; AST, aspartate aminotransferase; AFP, Alpha-fetoprotein. HS-1200, N-[(3a,5b,7a)-3,7-dihydroxy-24-oxocholan-24-yl] b-alanine benzyl ester.

