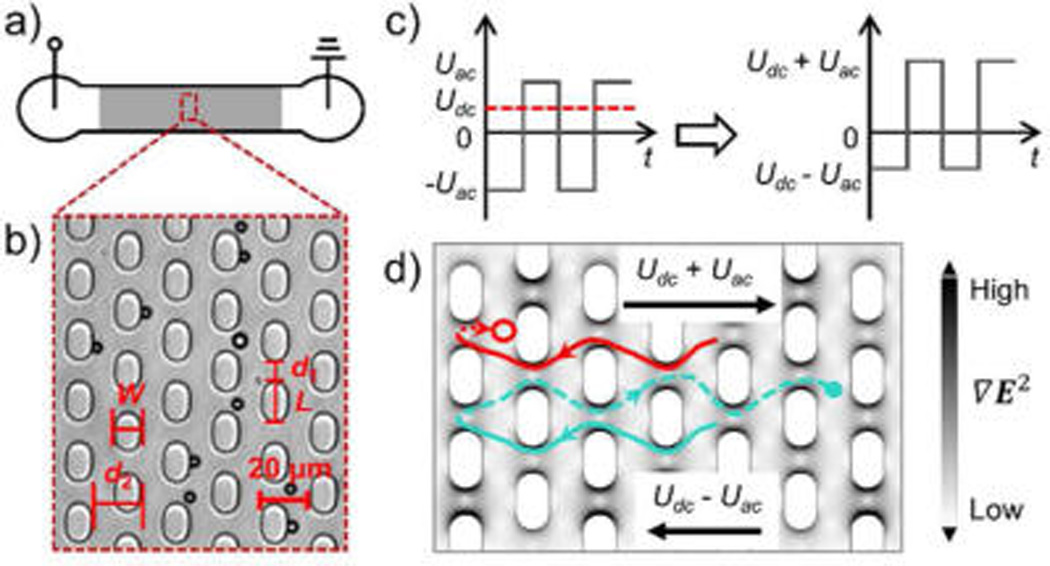
Figure 1.

(a) Top view of the 1 cm long channel (not to scale). The shaded area refers to the post array section in the channel. (b) Bright field microscopy image of a section of the post array region. W, L, d1, and d2 refer to post width, length, gap distance, and row distance, respectively, and are defined in the Numerical Modeling section. The dark circles correspond to 4.4 µm polystyrene beads. (c) The combination of an AC amplitude Uac and a DC offset Udc results in a waveform used in both simulation and bead experiments. (d) The dANM behavior (red trace) and the normal migration (turquoise trace) in one driving period are shown. Particles are assumed to exhibit negative DEP (nDEP, particles move away from high electric field gradient) and are also subject to electrokinetic migration. In the first half period at the applied potential Udc − Uac, particles are transported to the left and the trajectories are depicted by solid lines. When particles migrate to the right in the second half period at Udc + Uac, two situations occur: (1) For large DEP forces, particles are trapped near a post as indicated by the red dashed line and circle (end position of particle after one period). This situation relates to dANM, as the particle migrates opposite to the average force (Fav). (2) For small DEP forces, particles migrate through the gaps, as indicated by the turquoise dashed line and dot (end position of particle). This relates to normal migration behavior following Fav. The surface plot shows the gradient of the electric field (see grayscale).
